


For centuries, the stethoscope was a wooden ear pressed against a living chest. Doctors listened for thumps and murmurs, trusting their ears to diagnose life itself. But the heart’s true language remained hidden in the dark. Silent electrical failures slipped past every trained ear, leaving patients vulnerable to sudden, unexplainable collapses. Willem Einthoven watched these deaths with a growing sense of helplessness. He wasn't just curious; he was haunted by the gap between what doctors heard and what actually killed their patients.
Einthoven decided to stop listening. He needed to see the invisible. In 1903, working out of Leiden University, he built a machine that felt more like a torture device than a medical instrument. The string galvanometer was massive, occupying half a room, demanding absolute stillness from everyone present. To bridge the gap between flesh and physics, he asked patients to dip their hands and one foot into heavy ceramic buckets filled with saline solution. The saltwater stung open cuts, but the discomfort was necessary. Their bodies became conductive bridges, turning biological rhythm into measurable current.
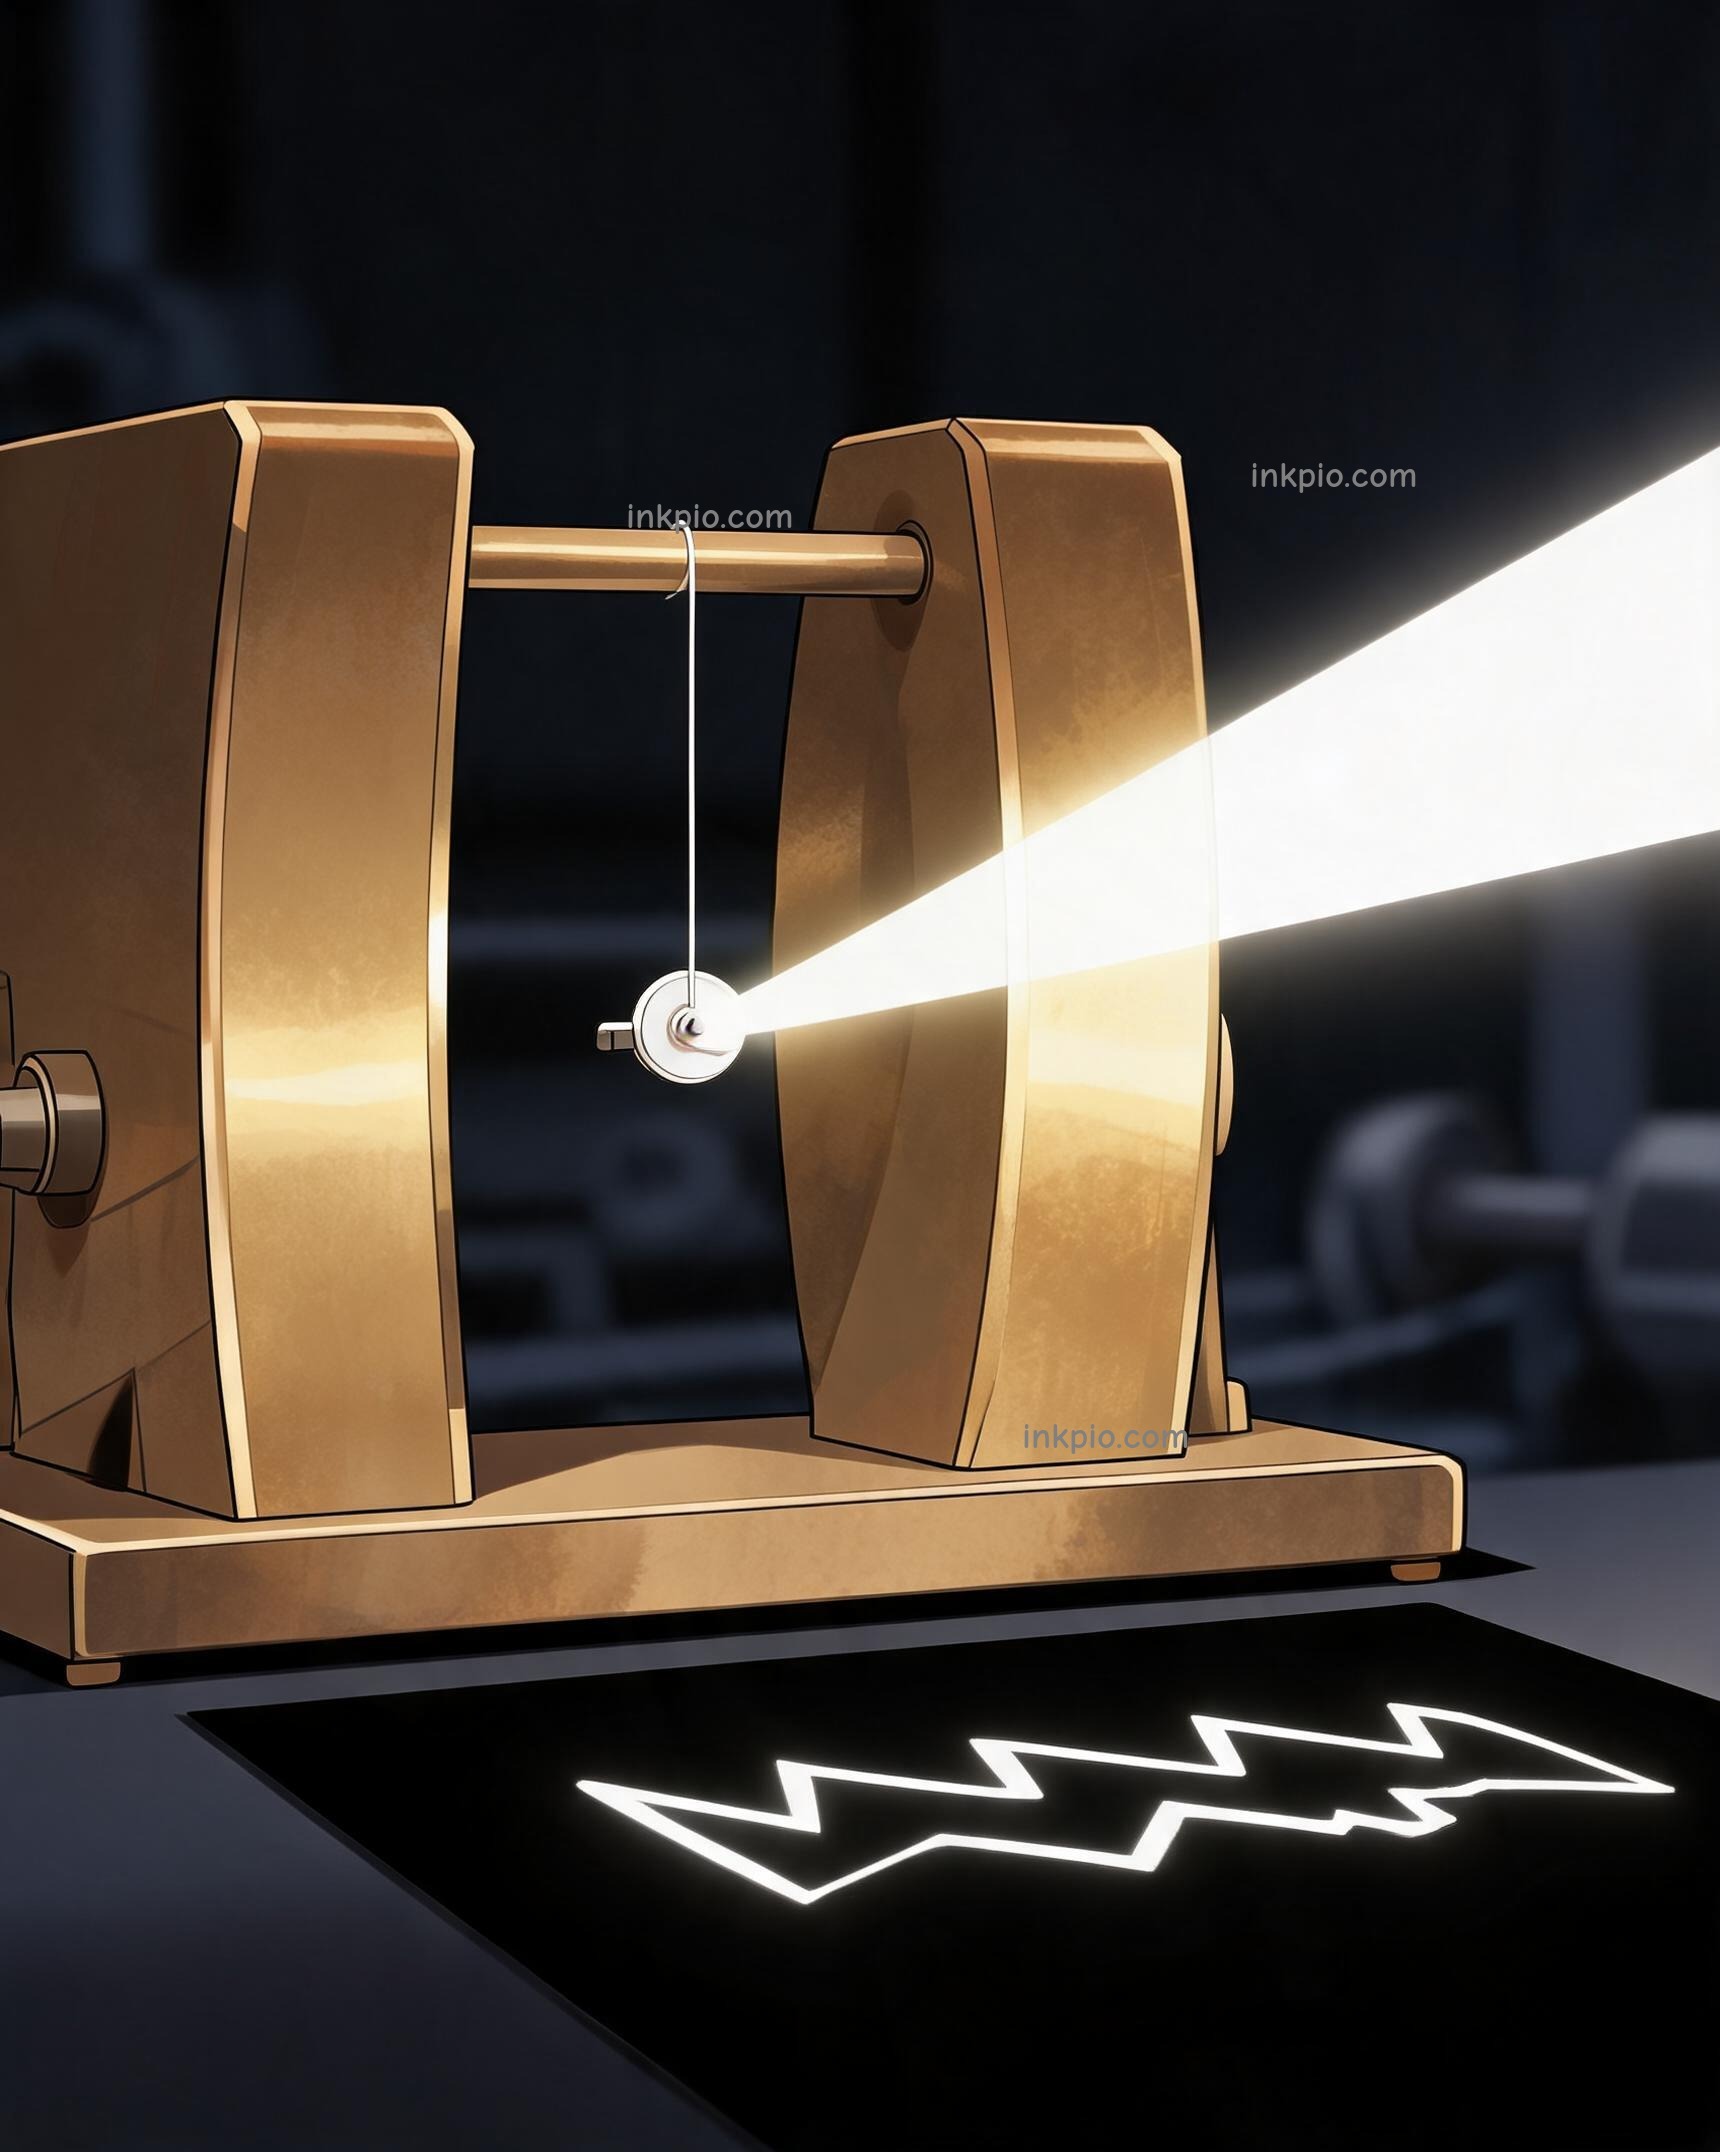
Those faint heart pulses traveled down thick copper leads, reaching a quartz thread so fine it was nearly invisible. Suspended in a magnetic field, this fragile filament was the only thing standing between chaos and clarity. A focused lamp bounced off the trembling thread, projecting a bright dot onto a roll of photographic paper sliding underneath. Every time the heart fired, the thread twitched between heavy brass magnets. The light painted a sharp zigzag on the moving film. It was a delicate dance of optics and electricity, requiring patience that bordered on obsession.
The first results were messy scribbles. Einthoven spent months tweaking the magnetic field and adjusting the thread tension. He worked late into the night, eyes straining against the dim light, refusing to accept noise as an answer. He needed a signal. Slowly, the chaotic lines smoothed into a reliable rhythm. He watched the fresh paper feed out of the drum, holding his breath as the ink dried. "The string galvanometer made it possible to record the electrical currents of the heart with unprecedented accuracy," he wrote. It wasn't just a technical achievement; it was a confession of relief.
By 1906, the mess had become a map. Einthoven published the first standard tracing, identifying five distinct dips and peaks. He labeled them P, Q, R, S, and T. These letters weren't arbitrary; they were the alphabet of a new language. The repeating pattern proved once and for all that a heartbeat was an electrical phenomenon. For the first time, doctors could see the exact shape of the electrical cycle. The jagged peaks turned centuries of blind guesswork into a practical diagnostic tool.
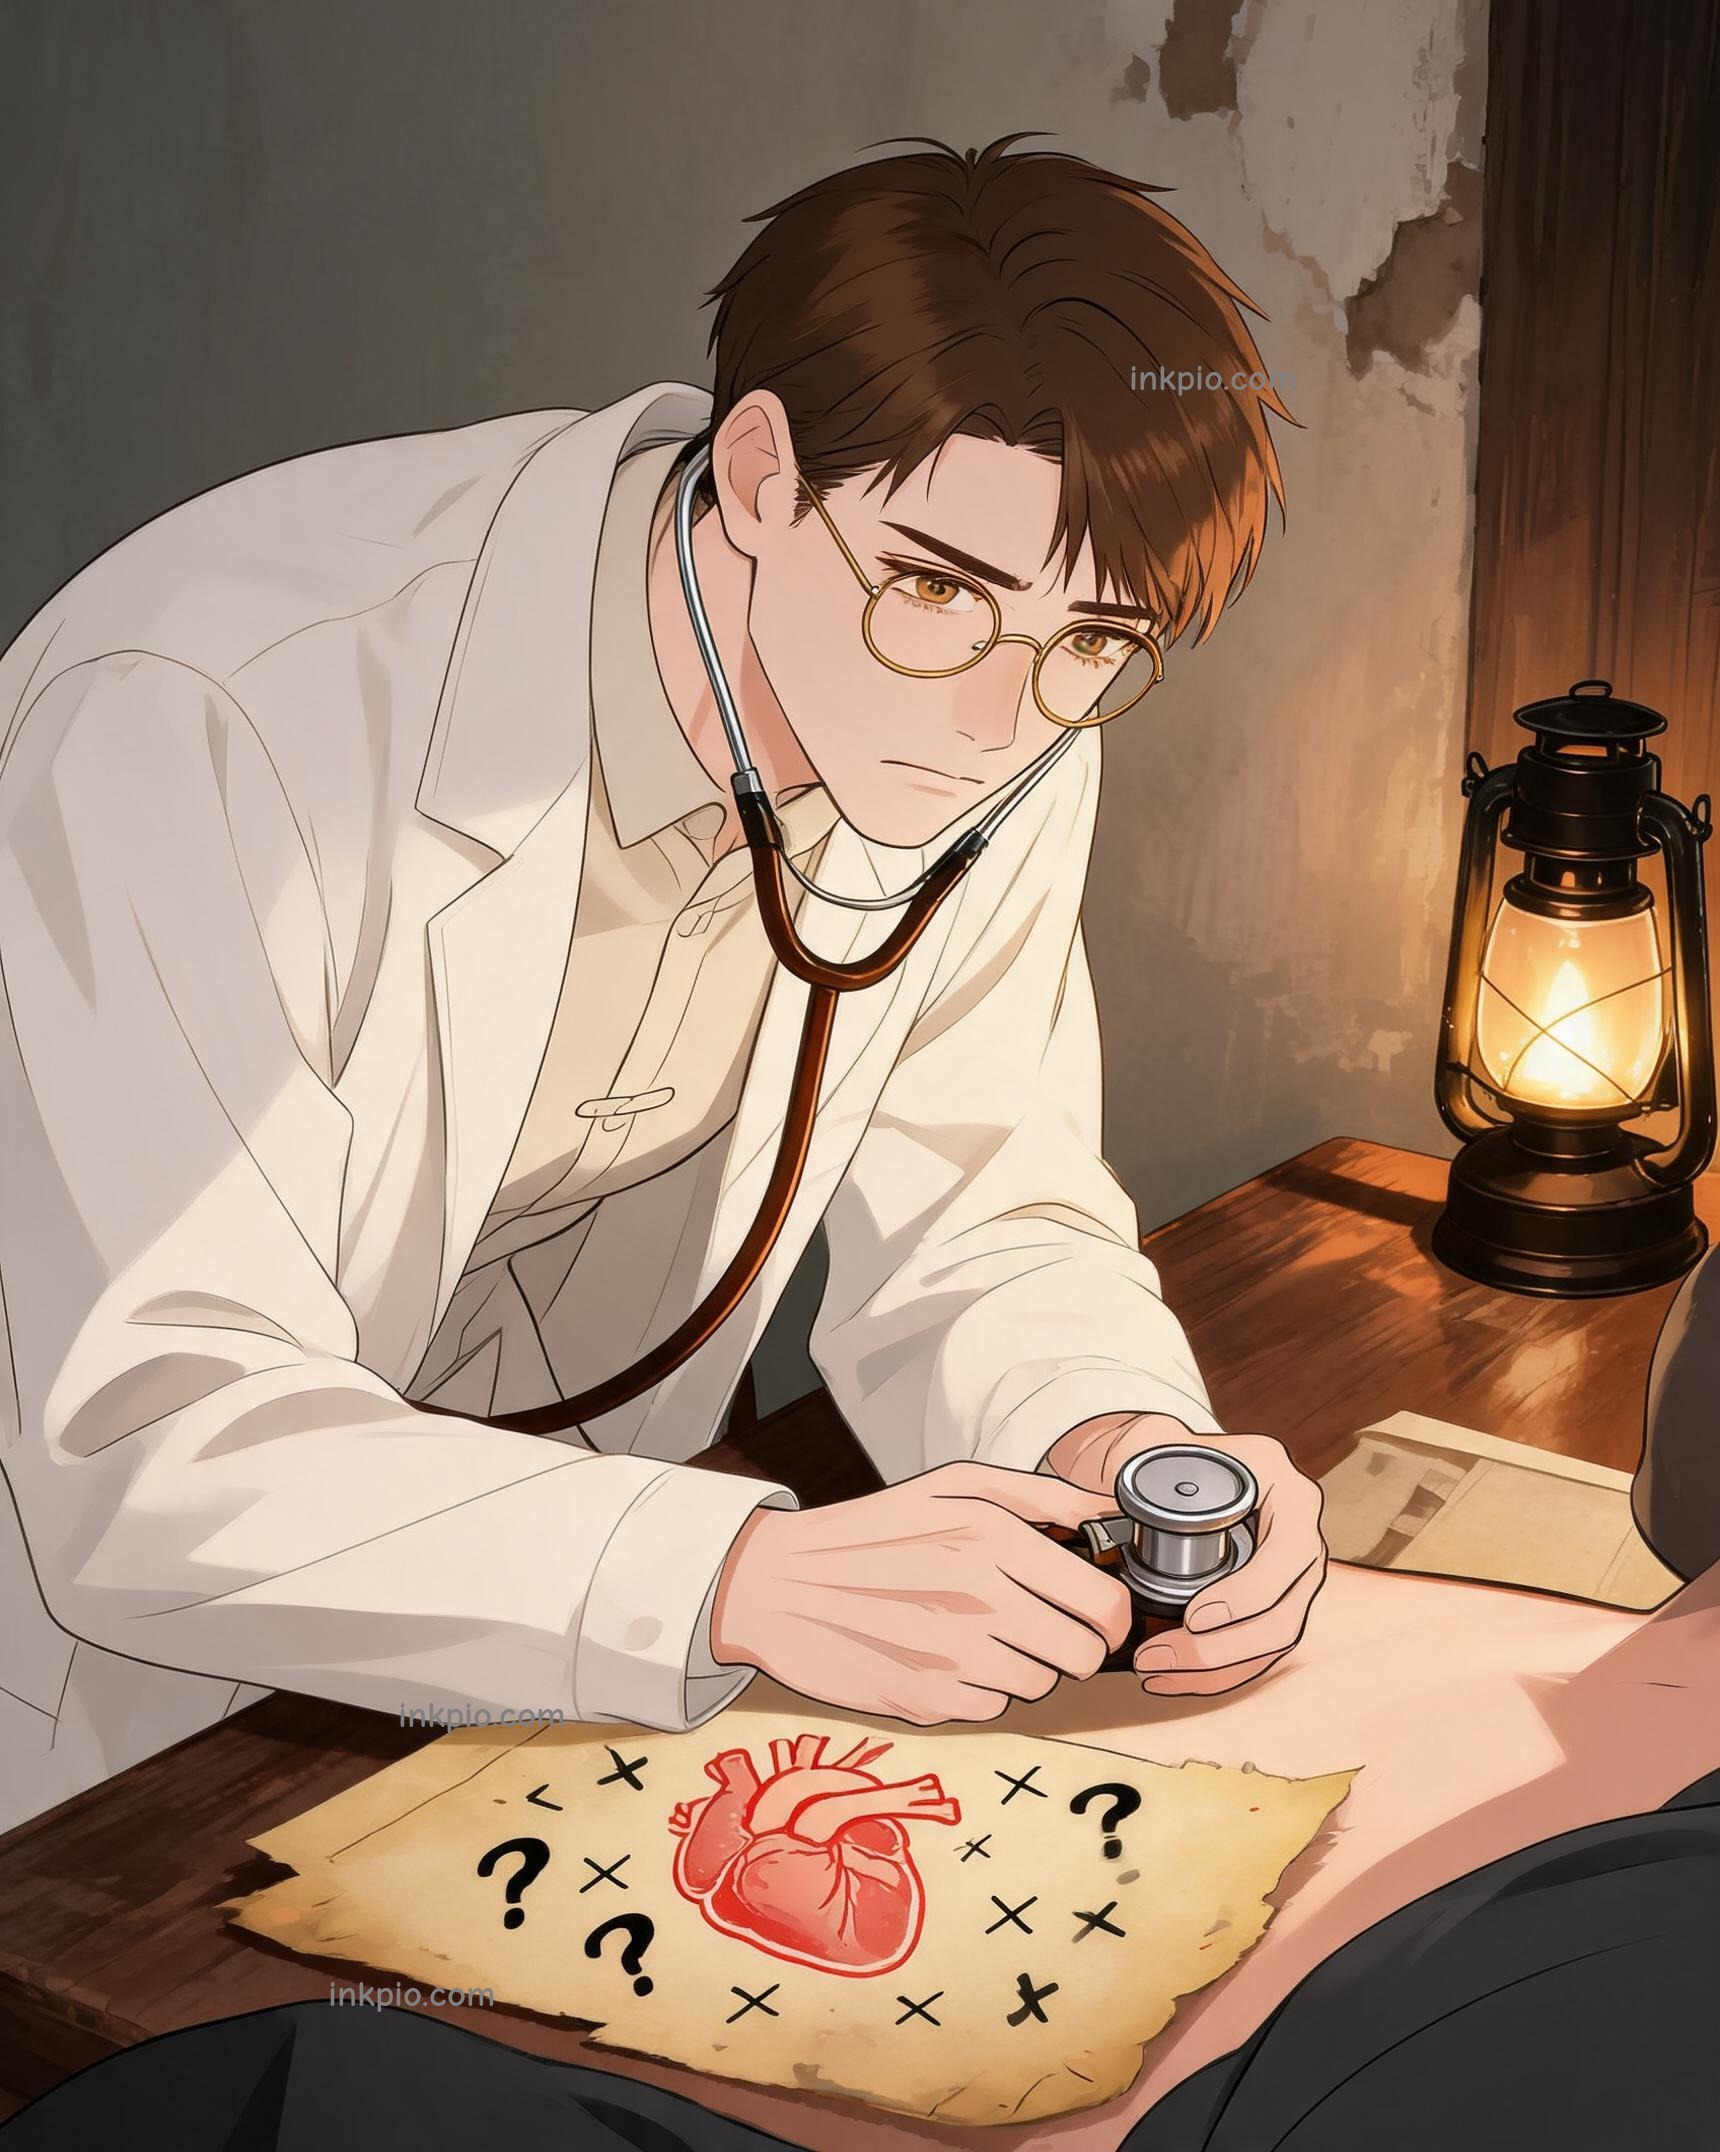
Imagine being the first person to see your own heart’s secret code written in light. The patient sitting with limbs in saline buckets might have felt cold or anxious, but on that paper, their life force was captured in bold, black lines. Einthoven stared at the PQRST waveform. It was no longer a mystery. It was data. Medicine had spent generations tapping in the dark, relying on intuition and luck. Now, they finally had a flashlight. The silence of the heart had been broken, not by sound, but by sight.